Wireshark Analysis
SMB Protocol Analysis
Below is a generic packet capture for an SMB2 session from my last position. This particular capture did not reveal the issue with the customer performance, but did provide some evidence of a functional setup which is useful for ruling out potential sources of network errors. A few things of note reading this process.
Fragmentation is hard to detect in modern systems due to the TCP Offload engines built into network cards and managed by operating system kernels. When tools like tcpdump read the network stack, fragmentation and assembly have already occurred in hardware, then passed to the kernel. The packet capture utility cannot see the fragmentation unless this module is disabled, which would severly impact performance making it impractical.
The speed of networks and network hardware make remote troubleshooting of network events more difficult. This is even worse when virtualization is involved. The network is increasingly abstracted away from the operating system kernel. To get at the network issues on a hardware device often requires drivers or utilities from the manufacturer to read directly from the hardware. There are ways to infer but it is a challenge.
The SMB2 capture here uses a rotating capture feature within tcpdump to keep a configurable number of smaller pcap files. For instance, 10 pcap files no larger than 4G each. When 4G size is reached, a new file is written to. When 10 total is reached, the first file is overwritten and so on. One can fill up a filesystem very quickly without this. Unfortunately Wireshark complains about truncation. This can be misinterpreted by those inexperienced with using this feature. For this example, the error occurred most often somewhere in the middle of a transfer and was difficult to pinpoint. The strategy was to write a bash script and kick if off via cron six hours after the start of the file transfer and to kill the capture three hours later. All the events occurred within that time frame. Also, since the test was the only traffic running during this time, there was a high probability that the pcap file with the most recent timestamp of the 10 would be the one containing the error. This turned out to be the case, but I no longer have that pcap file. See man tcpdump for rotation options: Rotate tcpdump files, limit file size
Here are some useful techniques in Wireshark for getting a general idea of what is happening with a network flow. This capture indicates a likely MTU on the system in question set to 1500, with 14 bytes added for overhead on the protocol. This would be a continuous stream as the lengths are mostly that size. Note the bottom left, "Packet size limited during capture", indicating our truncation and rotation method.
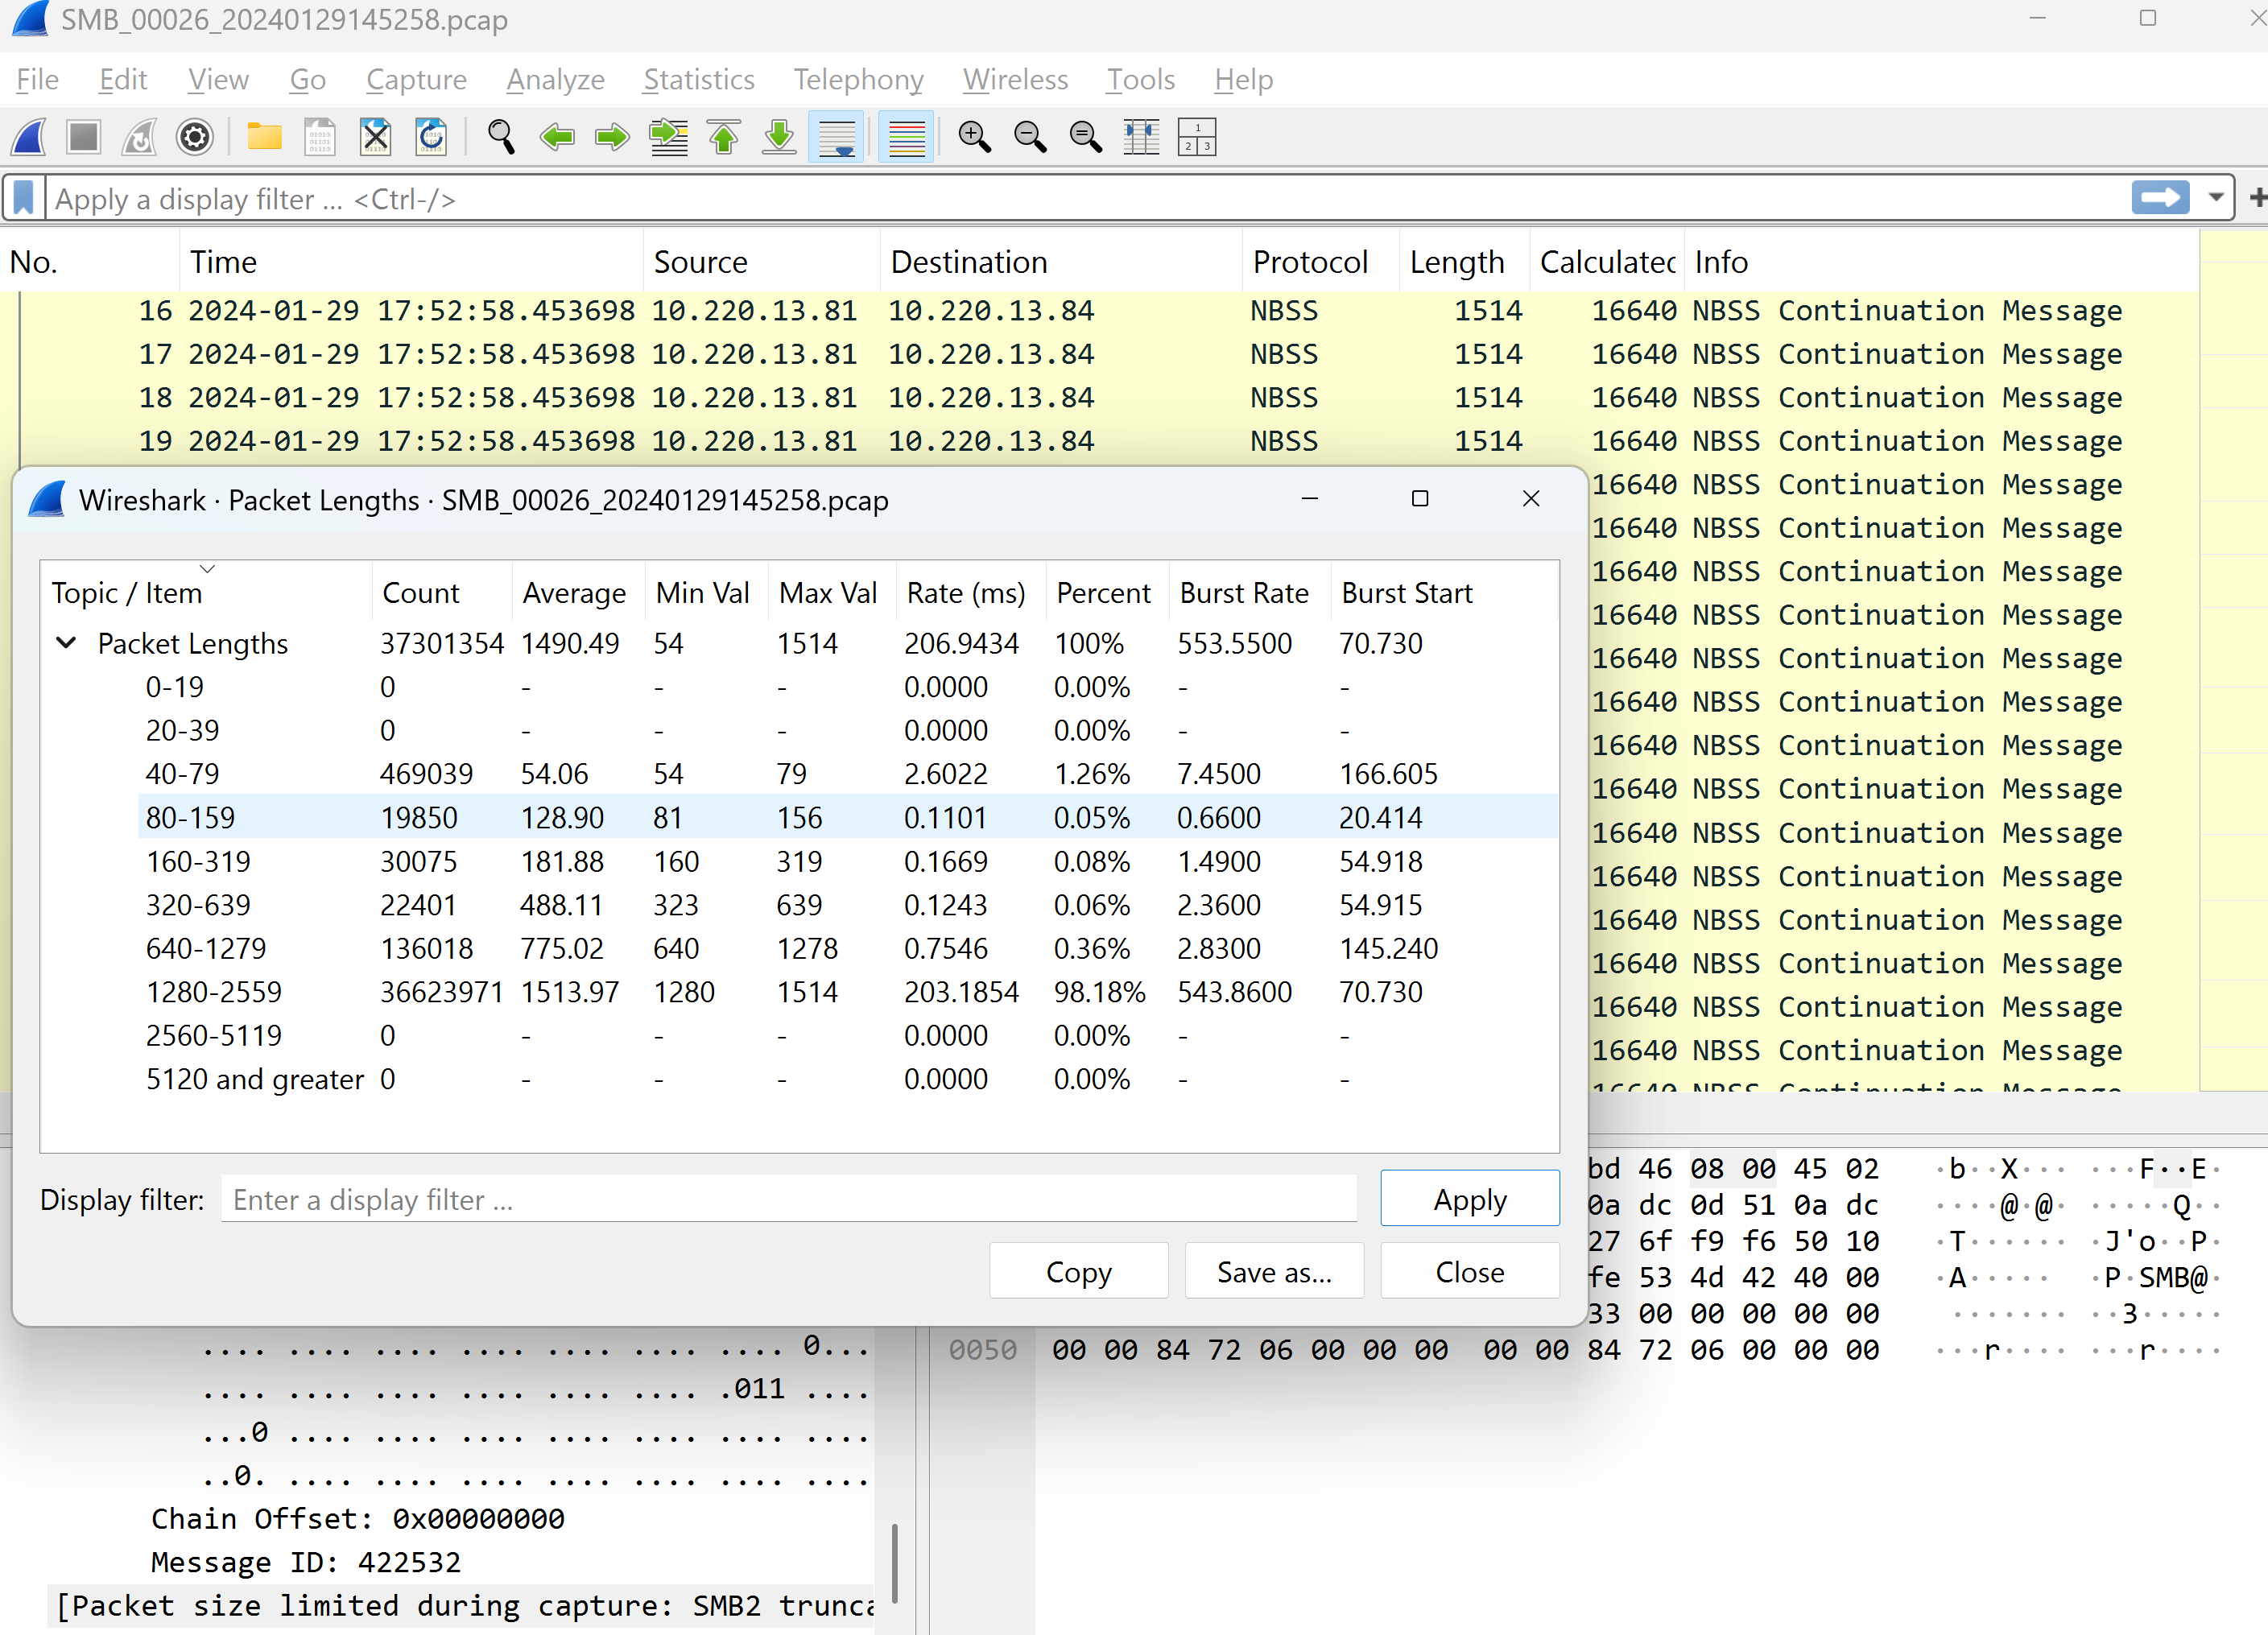
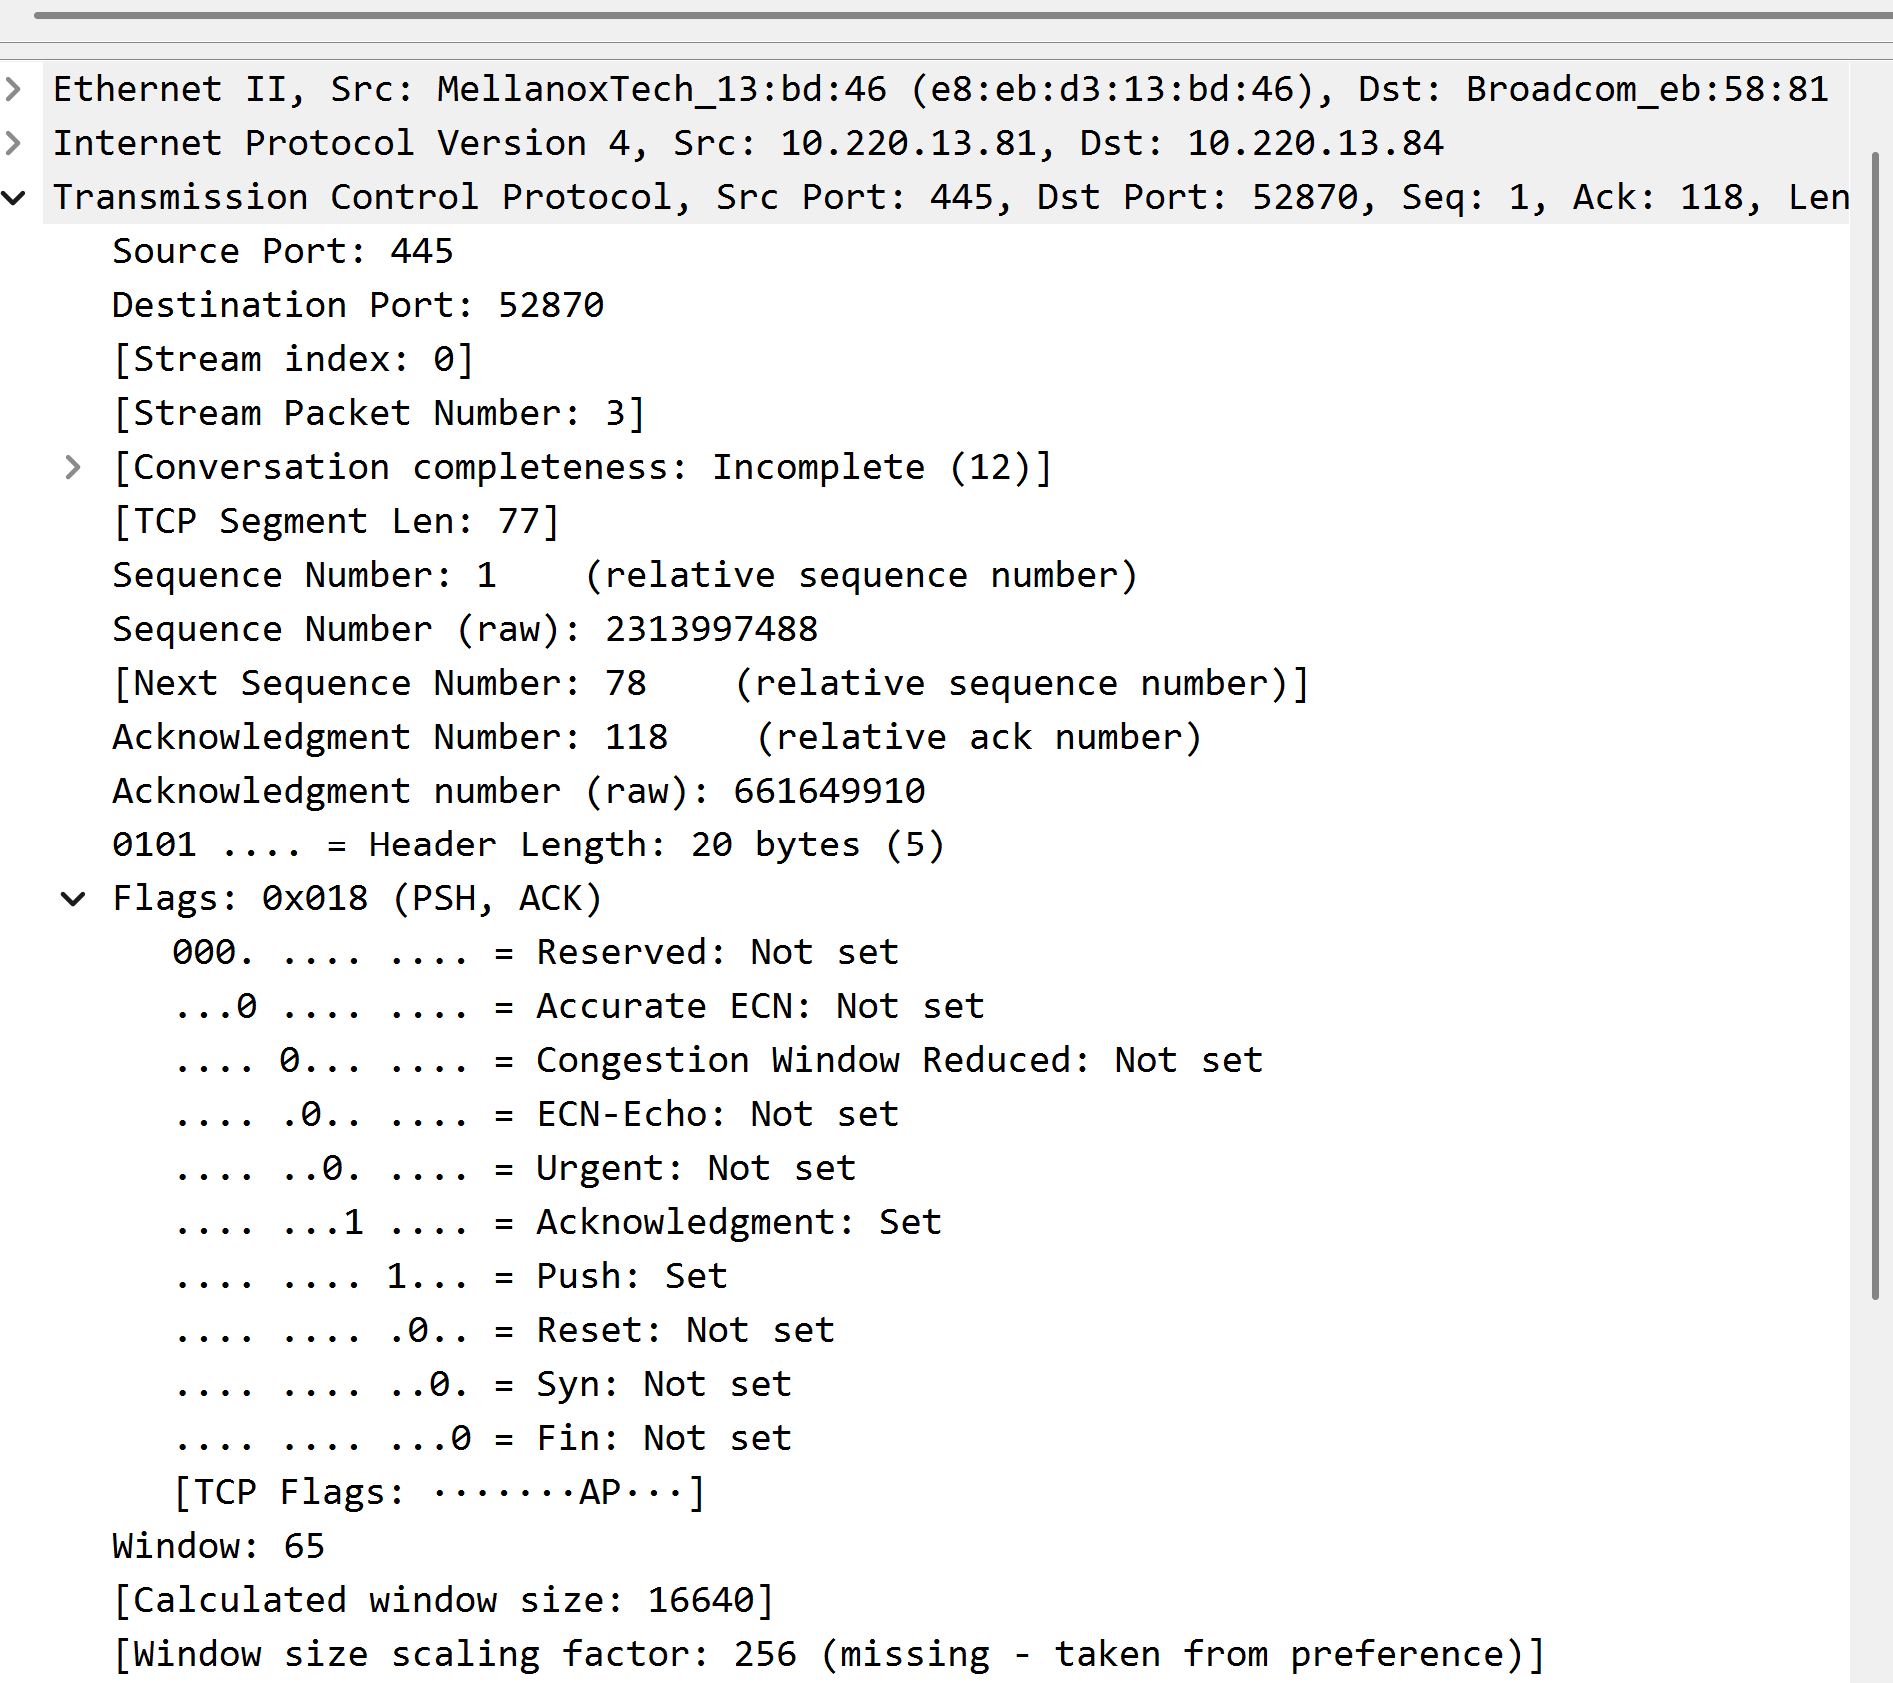
There are issues to account for when using a rotating packet capture. First off, window sizes and scaling come into play. The max window size is 65535 bytes. To get around this limitation, most modern network devices use a negotiated (at session start) scaling factor to increase performance. As can be seen in the screenshot below, this value is set via preferences in Wireshark and NOT found in the capture. This capture was part of rotation of files and did not capture the scaling factor at session start. There's a clue here about the window scaling even without the value being captured at the beginning of the session if you look close at the packet length values. In this capture, the ACK values, which are small in length, are only 1.26% of the total compared to over 90% for the 1514 byte sizes. Window scaling limits the number of packets per ACK ( window size X scaling factor) up to 1G. For more information on this, see this article: Wikipedia TCP Window Scaling
This is just a small snippet of the level of Wireshark network analysis I have done in my career. Different protocols, like NFS, SMTP, HTTP, and the like have unique headers that come into play just like SMB. There have been customers whose SMB dialect negotiated to an older version, causing issues because the SMB version on the file server supplied by my employer supported newer dialects. In rare cases, LM was found, and more often NTLMv2 was offered. This came out in an analysis. Not covered here, but of course the first to look for is retransmissions, which are highlighted the color red are obvious points of concern. DNS queries, especially in an Active Directory environment, can be very complex due to the use of SRV type records. My plan with writing this article is to demonstrate some more esoteric features of Wireshark that my peers over the years rarely or do not use. Under Statistics, the IO Graphs can be useful, as can the Service Response Times where the protocol is supported(SMB2 is).