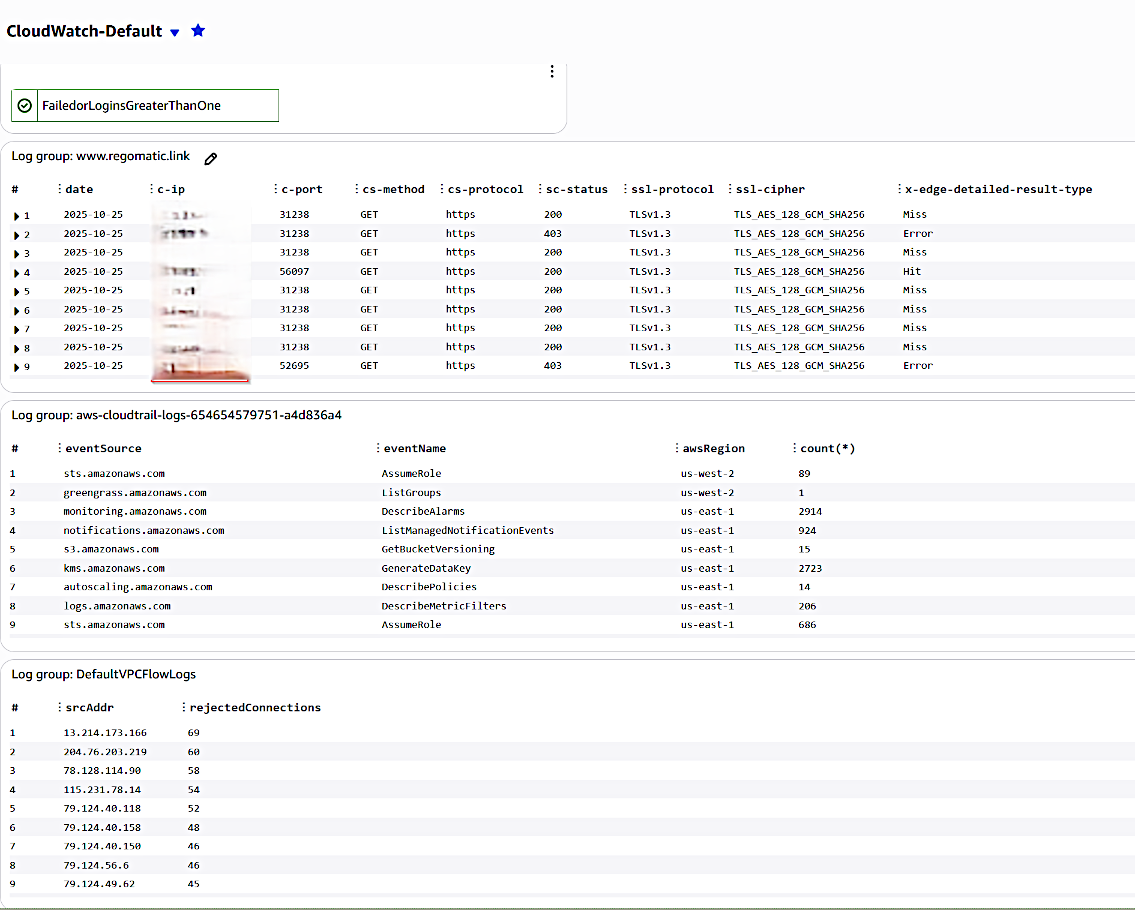
Cloudwatch Security Dashboard
Cloudfront Logs
fields @timestamp, @message, @logStream, @log | filter @x-edge-detailed-result-type != "ClientGeoBlocked" | sort @timestamp desc | display `date`, `c-ip`, `c-port`, `cs-method`, `cs-protocol`, `sc-status`, `ssl-protocol`, `ssl-cipher`, `x-edge-detailed-result-type`
Cloudtrail Query Counts with Regions
stats count(*) by eventSource, eventName, awsRegion
VPC Flow Logs - Top REJECTED IPs
filter action = "REJECT" | stats count(*) as rejectedConnections by srcAddr | sort rejectedConnections desc
Composite Login Alarm
Created three unique metric filters with alarms:
RootLogins - This Organization does not use the root account. It has an admin role that can be assumed at login. Root should only ever be used in emergencies.RootLoginMetric >= 1 for 1 datapoints within 5 minutes
ConsoleFailedLogins - Attempted brute force login attempts to be monitoried.
ConsoleFailedLogins > 1 for 1 datapoints within 5 minutes
Organization logins - At the time of this writing, only one user should be concurrently logged into the ORG.
"OrgName"_logins_metric >= 1 for 1 datapoints within 5 minutes
A composite alarm is created to aggregate all alarms into one to keep the dashboard clean.